Skip to content

Dashboards & Analytics

One trusted view of how your business is performing.

We build dashboards and reporting that bring data from your CRM, accounting, scheduling and operational systems into one place — with clear definitions and numbers that update on their own.

A company owner walks two colleagues through charts on a conference room display.

Overview

What we deliver

Most growing businesses have more data than they can use. It sits in the CRM, the accounting software, the scheduling tool and a handful of spreadsheets, and turning it into a clear picture of performance usually means someone spending hours exporting, cleaning and reconciling numbers by hand.

We build business dashboards that give everyone one trusted source of numbers. We start by agreeing on what each metric means and where it comes from, then connect your systems so data refreshes automatically and is calculated the same way every time. When leadership, managers and teams look at revenue or performance, they are looking at the same figures.

Good reporting is designed around decisions, not data. We focus each dashboard on the questions the people using it actually need answered — from executive summaries to day-to-day operational views — and make it easy to drill into the detail when a number needs explaining.

Business problems

What this solves

The issues we hear most often from businesses before a project like this begins.

  • Reports take days to assemble

    Someone exports data from several systems each week and rebuilds the same spreadsheet by hand.

  • Different numbers in every meeting

    Sales, operations and finance each report their own version of performance, and meetings turn into debates about whose figures are right.

  • No clear view across locations

    Each location tracks and reports differently, which makes fair comparisons and company-wide decisions difficult.

  • Data you cannot act on

    Plenty of data is collected, but it is not organized around the questions leadership actually needs answered.

Features & capabilities

What's included

  • Executive dashboards

    A concise view of the measures leadership watches most, with the ability to drill into the detail behind each number.

  • Operational reporting

    Day-to-day reporting on jobs, appointments, requests and capacity for the teams running the work.

  • Revenue dashboards

    Revenue, bookings, pipeline and receivables tracked over time and broken down by service, team or location.

  • Customer analytics

    Understand where customers come from, what they buy, how often they return and which segments matter most.

  • Performance tracking

    Targets and trends for teams, services and individuals, with clear comparisons from one period to the next.

  • Multi-location reporting

    Consistent metrics across every location, so leadership can compare performance fairly and spot issues early.

  • Clear metric definitions

    Every number is documented — what it measures, where it comes from and how it is calculated — so everyone reads it the same way.

  • Automated data refresh

    Data is pulled from your source systems on a schedule, so dashboards stay current without manual exports.

Example use cases

Where it fits

  • Multi-location performance

    Compare revenue, volume and service levels across locations in one consistent view.

  • Service business operations

    Track jobs, technician workload, response times and revenue for HVAC and home-service teams.

  • Property portfolio reporting

    Occupancy, maintenance activity and financial performance across properties, for managers and owners alike.

  • Hospitality reporting

    Bookings, occupancy, revenue and guest trends brought together from reservation and point-of-sale systems.

Related projects

View Our Work
lotledger.org
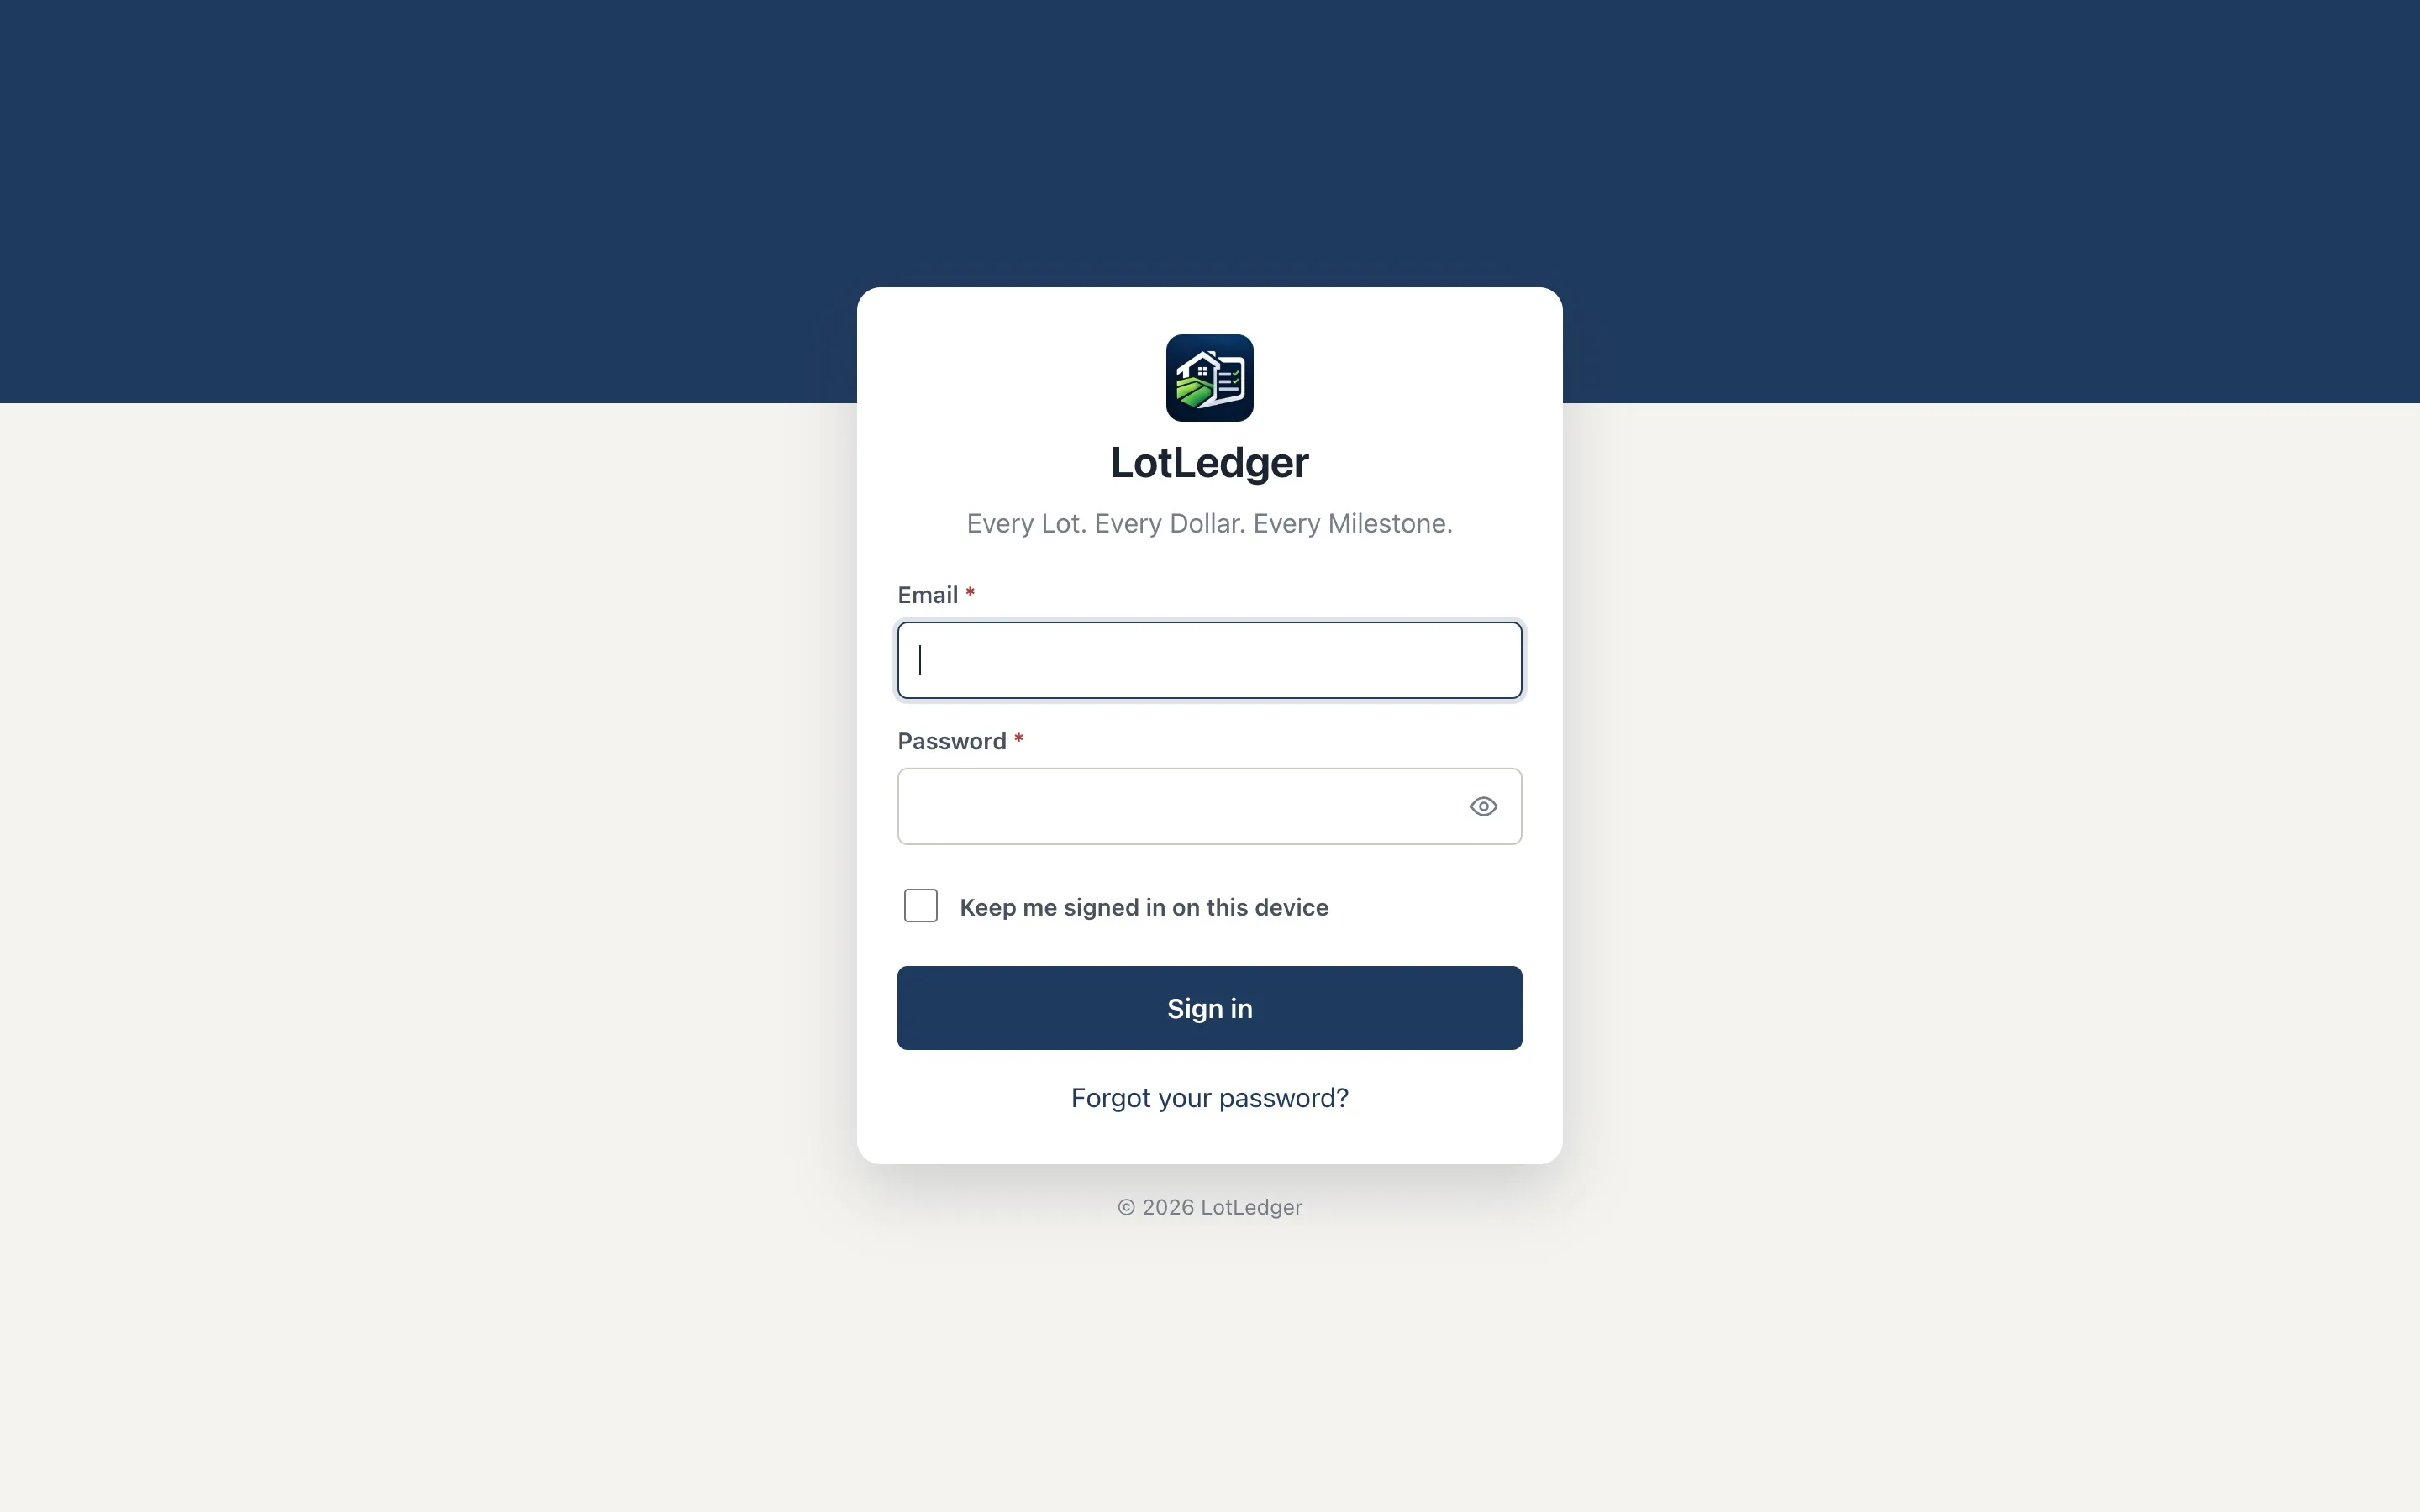
The LotLedger sign-in screen with the tagline "Every Lot. Every Dollar. Every Milestone."
Real Estate / Land Development

LotLedger

A web app that tracks every lot, dollar and milestone

A land-development operations platform for LotLedger that tracks subdivisions, phases and lots from acquisition to recording — with builder takedowns, loans, permits, documents, alerts and a built-in AI assistant.

  • Web Apps
  • Custom Software
  • Dashboards
  • AI Automation

How we work

Our development process

Every engagement follows the same disciplined path from first conversation to ongoing improvement.

  1. Step 01

    Discover

    Understand the business, existing systems, and the problems worth solving first.

  2. Step 02

    Design

    Plan the solution, the data and the user experience before writing production code.

  3. Step 03

    Build

    Develop, integrate and test the technology in focused, reviewable increments.

  4. Step 04

    Optimize

    Launch, support and keep improving based on how the system is actually used.

Related services

Custom CRM systems and CRM configuration that keep every customer, deal and follow-up organized around how your team actually sells and serves.

Dependable connections between your CRM, payment, scheduling and business systems, so information moves on its own instead of being re-entered by hand.

Custom business applications, portals and internal tools that replace spreadsheets and workarounds with software built around how you operate.

FAQ

Frequently asked questions

Have a question that isn't covered here? Get in touch.

Where does the data for our dashboards come from?

From the systems you already use — your CRM, accounting software, scheduling tools, payment processors and operational applications. We connect to each source, combine the data into a consistent structure and refresh it automatically.

What if our data is messy or inconsistent?

That is common, and it is usually the first thing we address. We identify gaps, duplicates and conflicting definitions, agree with you on how each metric should be calculated, and build the cleanup into the data process so it does not have to be repeated by hand.

How often do the dashboards update?

It depends on the source systems and how the numbers are used. Operational views may refresh throughout the day, while financial reporting often updates daily. We set a refresh schedule that matches how quickly each decision needs current information.

Can different people see different information?

Yes. Dashboards can be organized by role and location, so leadership sees the full picture while managers and teams see the numbers relevant to their work.

Do we need a separate reporting tool, or can dashboards live inside our software?

Either can work. Dashboards can be built into a custom application or CRM your team already uses, or delivered as a standalone reporting view. We recommend the approach that fits how and where your team makes decisions.

Have a project in mind? Let's build the solution.

Tell us what you're trying to accomplish. We'll help you determine the right technology to get there.